Every year, an average of 40,000 people die in car crashes on U.S. roadways. Over the past few years, the problem has only worsened. From 2020 to 2021, there was a 10% increase in fatalities. Within this, forty-three states saw increases in the number of deaths.
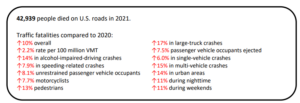
Sources: FARS 2019-2020 Final File, 2021 ARF; CRSS 2019-2021; 2019-2021 VMT – FHWA’s Annual Highway Statistics.
Data from the Virginia Department of Motor Vehicles shows that 1,005 deaths occurred on Virginia’s roadways in 2022. This is an increase of about 3.8% from the previous year. In addition to these fatalities, 2022 statistics show that 162 people were injured every day in the Commonwealth, with traffic crashes to blame. To reduce the frequency of collisions, the U.S. Department of Transportation (USDOT) has begun implementing a Vision Zero program.
What is Vision Zero?
Vision Zero is a traffic safety program that was first adopted in Sweden in 1997. The phenomenon has since spread around the world. The ultimate goal is to reach zero traffic deaths. The program is founded on the principles that humans make mistakes, and that human bodies have limited ability to tolerate crash impacts. With innovative roadway designs and speed management systems, Vision Zero has seen success in Virginia, among other states.
The first step in determining where implementations are necessary is to understand where crashes are occurring.
Where are the “hotspots” of fatal crashes?
USDOT has analyzed crash data and reported hotspots throughout the country. The areas highlighted below have a high fatal crash concentration. Several counties in Virginia are considered hotspots.
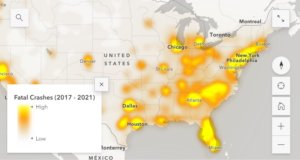
Source: USDOT National Roadway Safety Strategy
How do counties in Virginia compare to the US crash average?
Most counties in Virginia have a low or below-average fatality concentration level. However, areas surrounding Richmond, Virginia Beach, Charlottesville, and Northern Virginia have above-average and high fatality concentration levels.
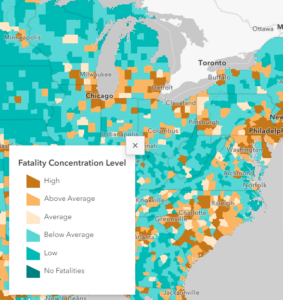
Source: USDOT National Roadway Safety Strategy
Henrico County, Hanover County, Chesterfield County, and Richmond City have some of the greatest fatality concentration levels in the state. In Henrico, there were 146 fatalities from 2017-2021, with 39 of those in 2021 alone. This is 2.4 times more than an average county. Similarly, Chesterfield County has a fatality concentration level 2.4 times greater than the average U.S. county.
Vision Zero’s crash reduction progress
The maps above reveal the terrifying reality of fatal accidents throughout Virginia, as well as the Eastern Seaboard. However, this does not have to be our reality. Vision Zero’s ultimate goal is zero traffic-related deaths by 2050. Progress has already begun, with several counties in Virginia experiencing zero fatal accidents. We hope to implement our communities with more Vision Zero programs in the future.
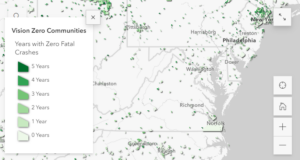
Source: USDOT National Roadway Safety Strategy
What Vision Zero policies have been implemented in Virginia?
- Speed safety camera programs
- Alternative street designs
- Lower speed limits
- Intelligent speed assistance
With thirteen kinds of intersections and seven interchange types, every choice is designed to better control the flow of traffic.
They include:
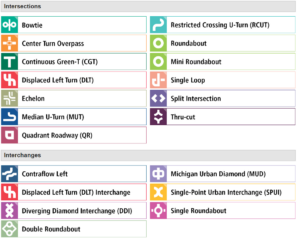
Photo Source: Virginia Department of Transportation
What are the benefits of these innovative changes?
- Improved safety
- Less serious injury or death
- Greater efficiency
- More cost-effective
- Shorter wait times
- Better traffic flow
When and where are these implemented?
VDOT considers many factors when deciding if an innovative intersection or interchange is more appropriate than a conventional intersection. Factors to consider include:
- Roadway geometry
- Traffic volume
- Crash patterns
- Pedestrian and cyclist use
- Design requirements.
Throughout Virginia, VDOT and local jurisdictions are working together to customize the specific demands of each roadway.
What are the most common intersections being implemented?
In Virginia, the most prevalent innovative intersection is a roundabout, displayed in light green on the map. The Continuous Green-T (Red) and Restricted Crossing U-Turn (Navy) are also being implemented frequently. The map below displays all current and developing innovative intersections in Virginia.
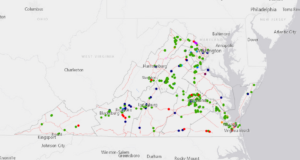
Photo Source: Virginia Department of Transportation
What is a roundabout?
Roundabouts are becoming more and more popular throughout the country. In Virginia, they are the most common innovative intersection. A roundabout is a circular intersection without signals. Within the circle, all cars move counterclockwise. On the outside, cars yield to the traffic already in the roundabout.
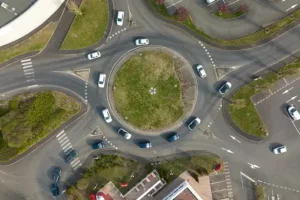
Because all vehicles move in the same direction, roundabouts decrease the number of crashes, especially deadly T-bones and head-on collisions. In addition, traffic moves at lower speeds, usually around 15-25 mph, so collisions are relatively minor. The Federal Highway Administration reports that roundabouts have lessened serious crashes by 78-82% in comparison to conventional signalized intersections.
In addition to safety benefits, roundabouts also provide increased efficiency and greater cost-effectiveness. How would a slower speed increase efficiency? The answer lies in the lack of signals in a roundabout. Because traffic yields to one another, there are fewer full stops, and thus, fewer delays. Without the necessity for maintenance of traffic signals, roundabouts also save money. At Allen & Allen, we recognize the importance of roundabouts and offer roundabout-safe driving suggestions.
With innovative changes to infrastructure, such as the addition of roundabouts, the number of deaths from accidents can be reduced.
While Vision Zero is working to make communities safer, our roadways aren’t entirely without incident. If you have been injured in an auto accident through no fault of your own, you may be entitled to compensation. Call Allen & Allen today for a free consultation at 866-388-1307.